
Lucy's Graphs
May 18, 2005
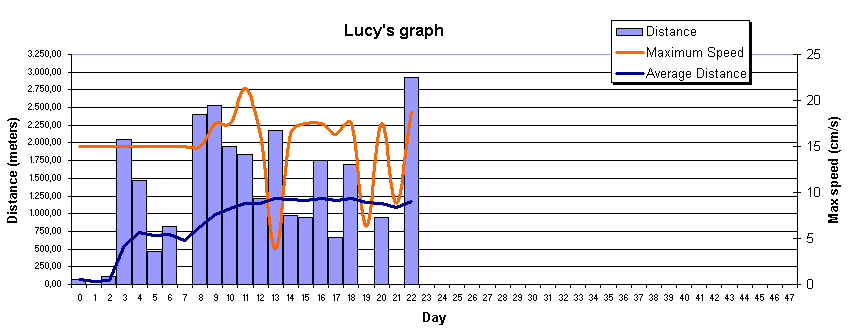
Lucy's final graph version 2
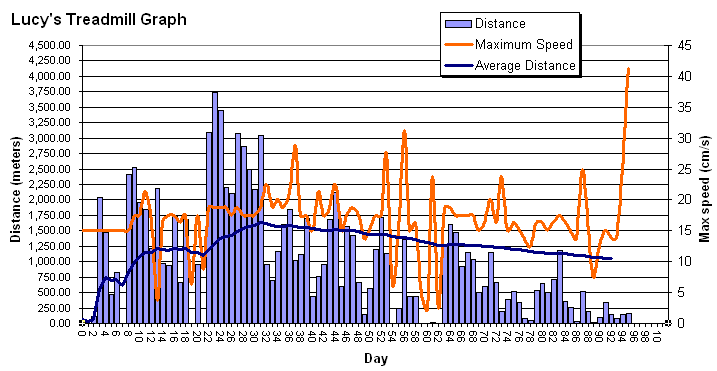
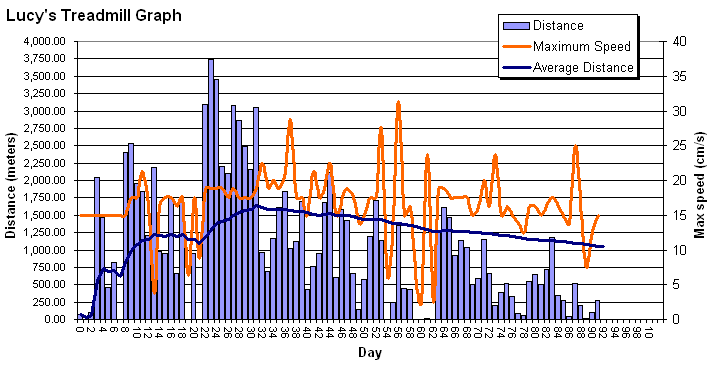
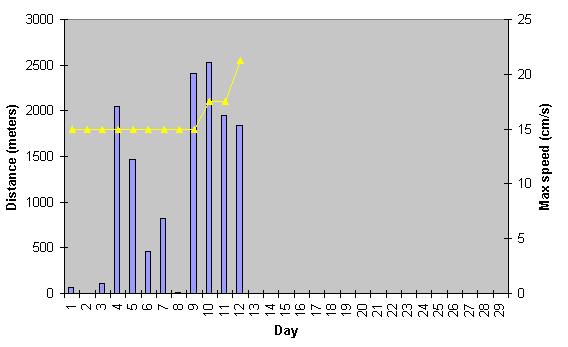
I noticed that somehow the Y axis of the treadmill graph changed. Now I changed it back to what it should be:
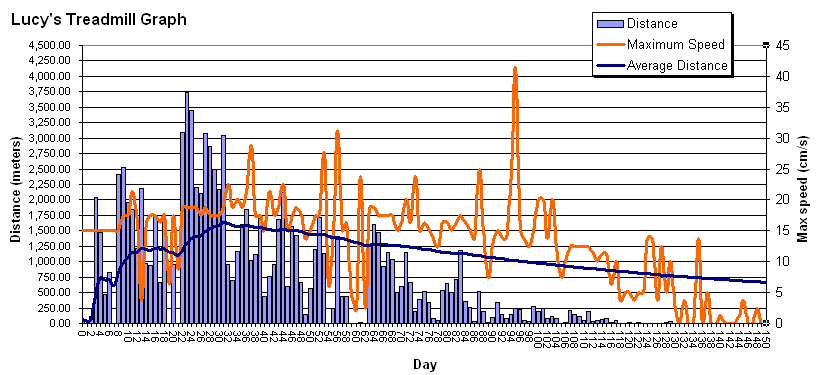
Now it's a lot more clear that Lucy was taking it very easy the last few weeks (even months). Next time this happens I will contact my Vet sooner. At the time I thought it could be well possible that Lucy didn't like running for a while...
May 17, 2005
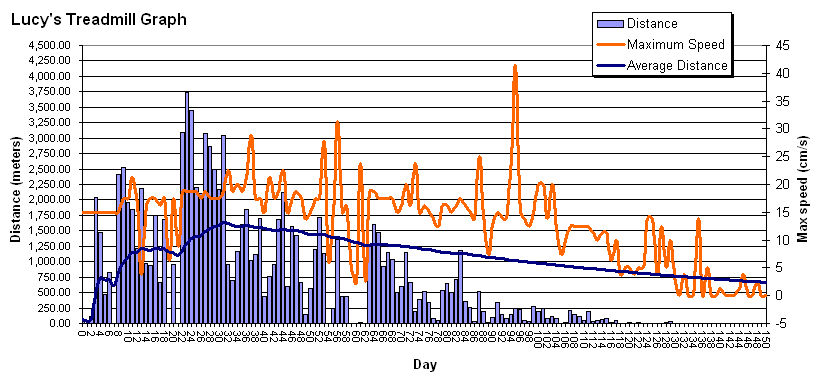
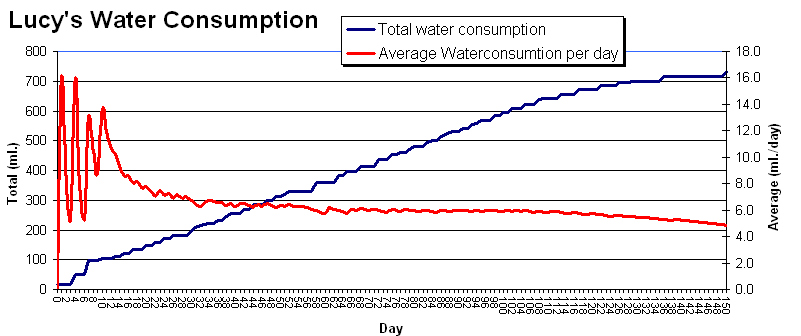
Lucy's final graphs
It took my a while to set myself to process all of Lucy's last data, but today I've done it.
March 22, 2005 (21:00):
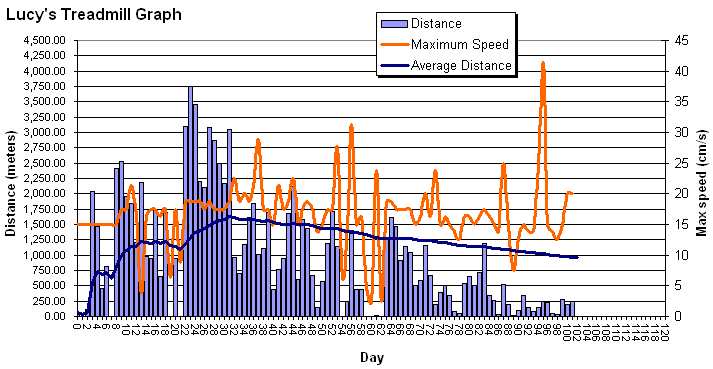
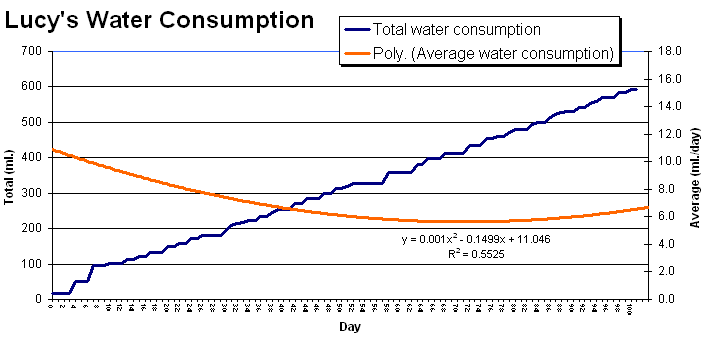 Please note that the scale has changed!
March 16, 2005:
March 12, 2005 (11:00):
March 3, 2005 (18:30):

February 16, 2005 (18:45):
Lucy ran another new record speed today!
January 31, 2005 (17:10):
Lucy ran another new record speed today!
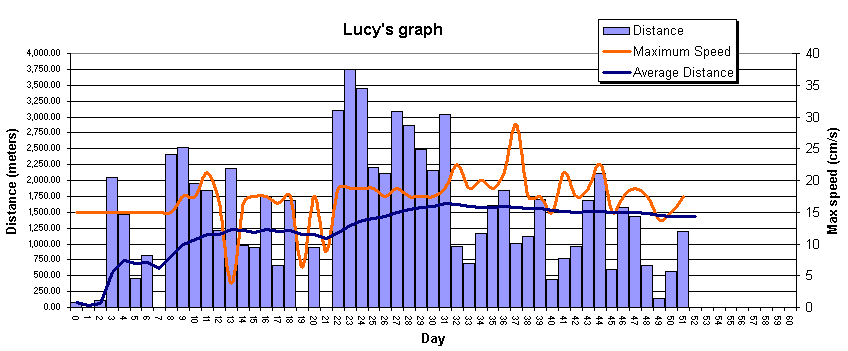
January 17, 2005 (17:10):
Lucy ran another new record speed today!
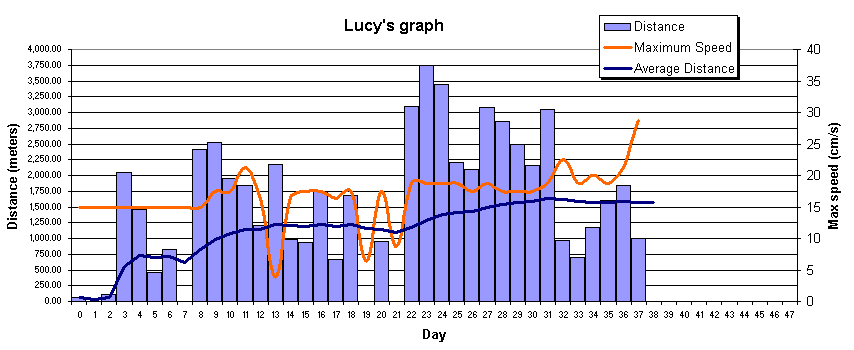
January 12, 2005 (18:30):
Lucy ran a new record speed today!
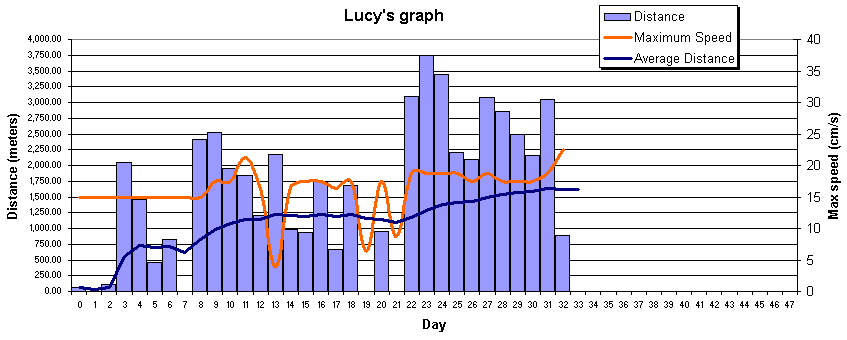
January 7, 2005 (6:00):
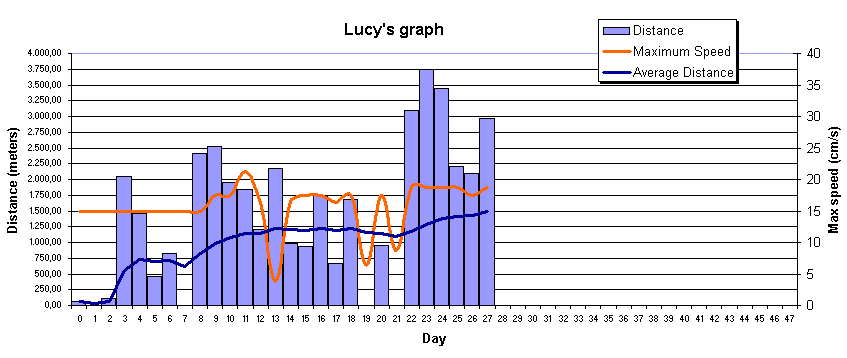
January 2, 2005 (13:00):
Lucy ran a personal long distance record, and the day isn't over yet!
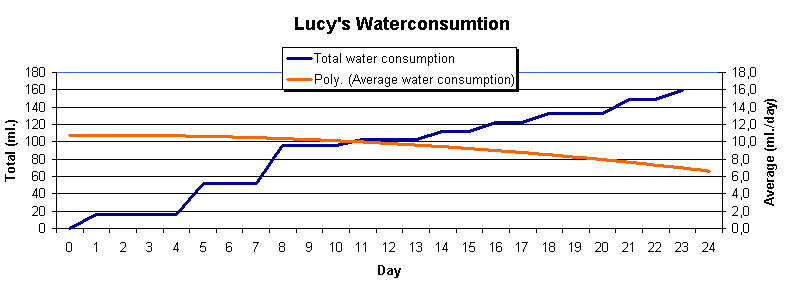
December 28, 2004 (18:00):
I just noticed that the day numbering is incorrect; day 1 is actually day 0. (Day 18 is actually day 17)!
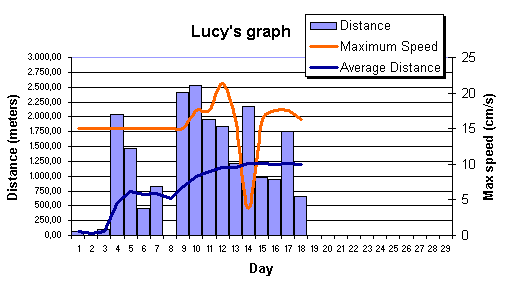
December 26, 2004:
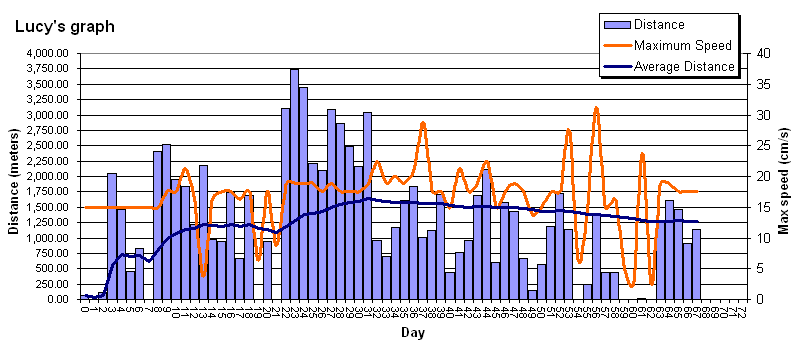
I've changed the layout, I think this one is more clear.
I also spent some time converting this picture to greyscale to make sure colorblind people can still view it. I hope this is true!
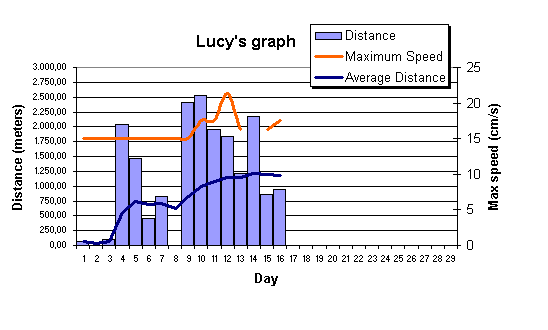
December 22, 2004:
© Copyright 1994 - 2008, Peacoque Labs
ing. Mathijs A. van der Paauw


